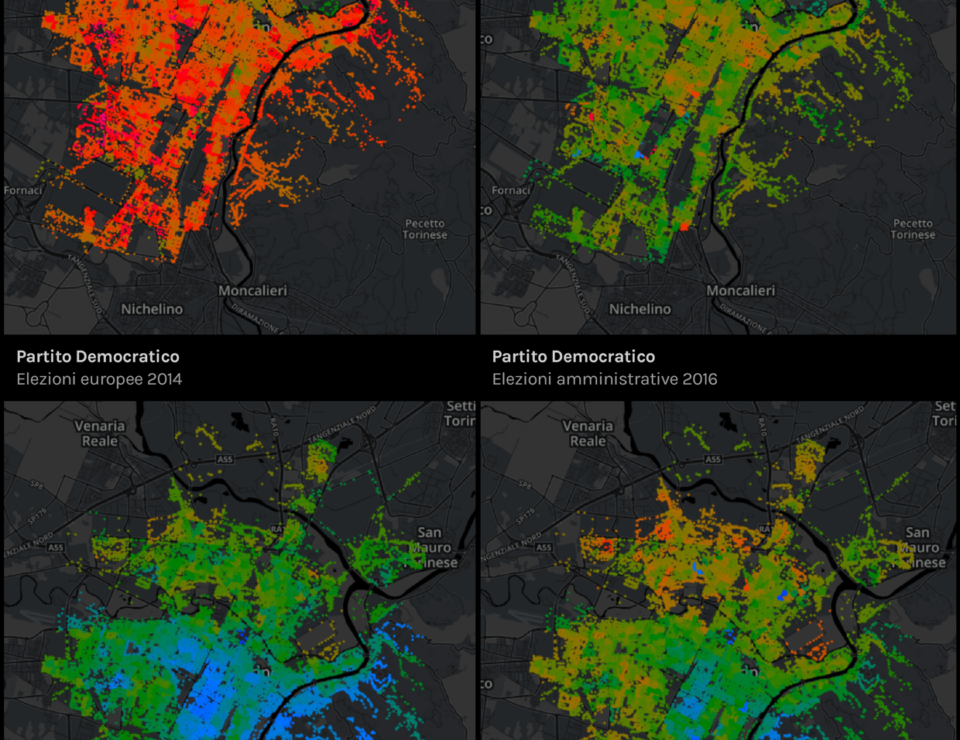
Il voto strada per strada is an interface designed to compare the electoral results in the urban context, in order to analyze the evolution of the political landscape of the city and to analyze the different dynamics that take place in the city center and in the periphery. more »
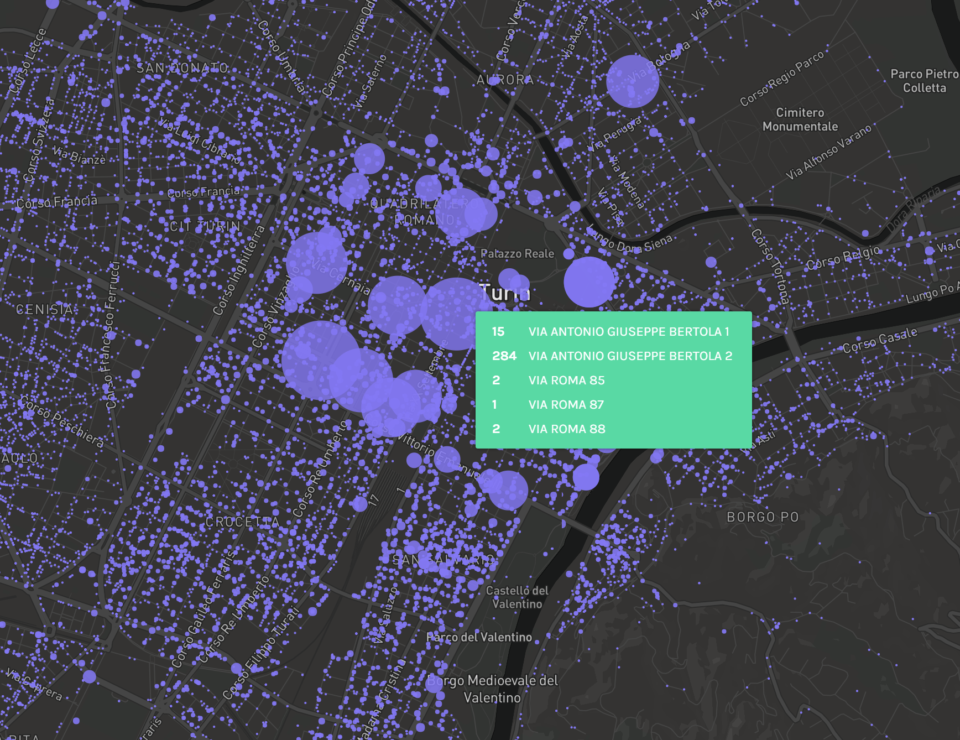
Infrazioni
Infrazioni (infractions) is a public interface for reports on traffic code violations in the city of Turin. The application allows to browse and explore more than four millions reports by combining filters on different dimensions of the data, such as date, time, day of the week, type of vehicle, type of violation, location. The data, made available on the Open Data portal of the city of Torino, was collected from the beginning of 2011 to the end of 2015 by the City Police force, and it contains more than million reports in more than 55.000 unique / more »

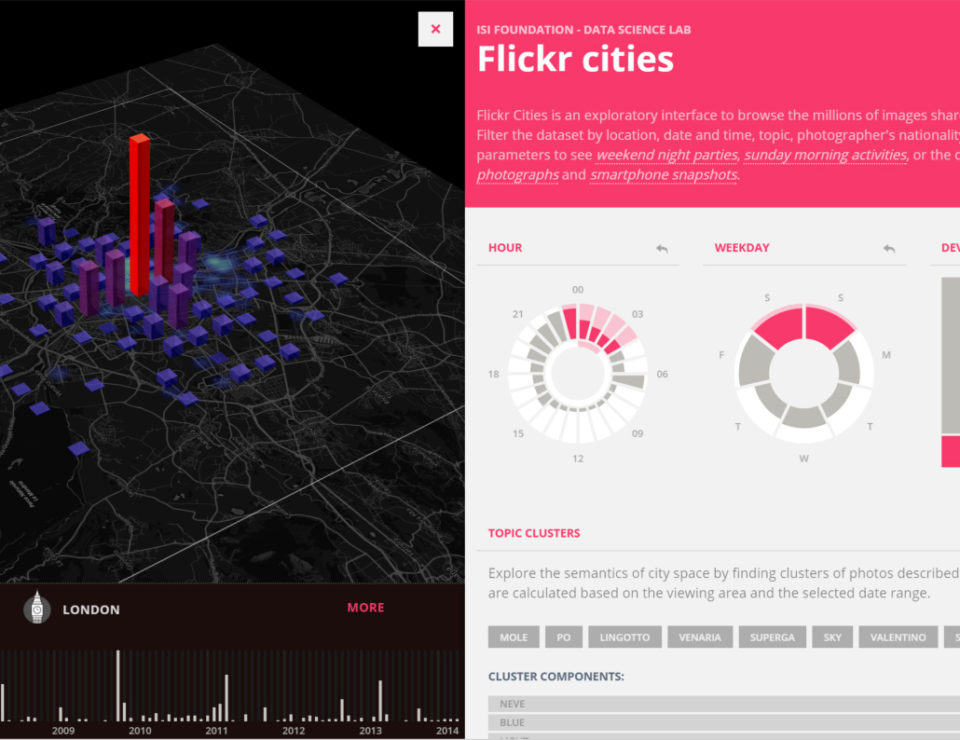
Flickr Cities
Flickr Cities is an exploratory interface designed to browse the photos shared by Yahoo Labs in its Yahoo Flickr Creative Commons 100M dataset. The aim of the app is to provide an easy way to filter, search and look into the pictures taken by thousands of Flickr users over the course of eight years in seven major cities around the world. In the first release, Flickr Cities displays a sample of 100.000 photos for each city, allowing the user to filter and browse the images by combining several parameters. more »
FluOutlook
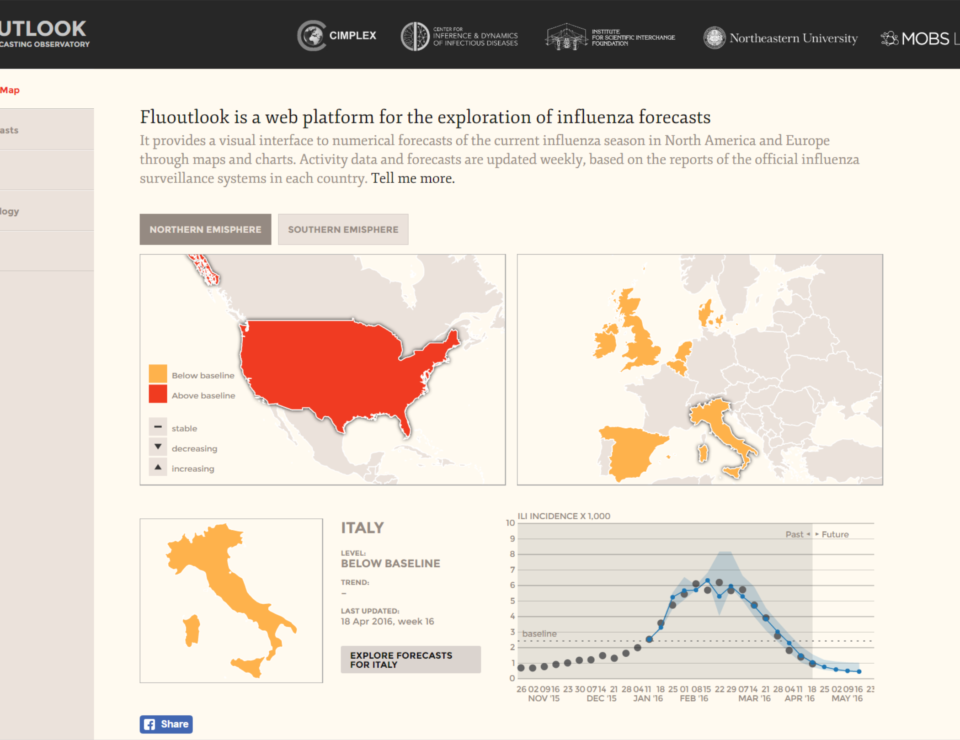
Fluoutlook is a web platform for the exploration of influenza forecasts. It provides a visual interface to numerical forecasts of the current influenza season in North America and Europe through maps and charts. Activity data and forecasts are updated weekly, based on the reports of the official influenza surveillance systems in each country. Activity data and forecasts are updated according to the availability of data from the official influenza surveillance systems in each country. In particular, for Europe, activity data is automatically collected from the ECDC website of surveillance of infectious diseases, and the / more »
EbolaTracking / ZikaTracking
EbolaTracking and Zikatracking are two projects that aim to track the awareness about epidemic events in a georeferenced context and in real time. By tapping into the Twitter Streaming API and monitoring tweets mentioning epidemic-related keywords, the applications analyzes and classifies tweets using a machine learning system trained with the supervision of experts. The data is the geolocalized matching geographical entities mentioned in tweets – such as country and city names – with the GeoNames database, and displayed on a map in order to shows events, i.e. groups of tweets that recently mentioned the same place. Blobs indicate mentioned / more »
From cortisone to graphene
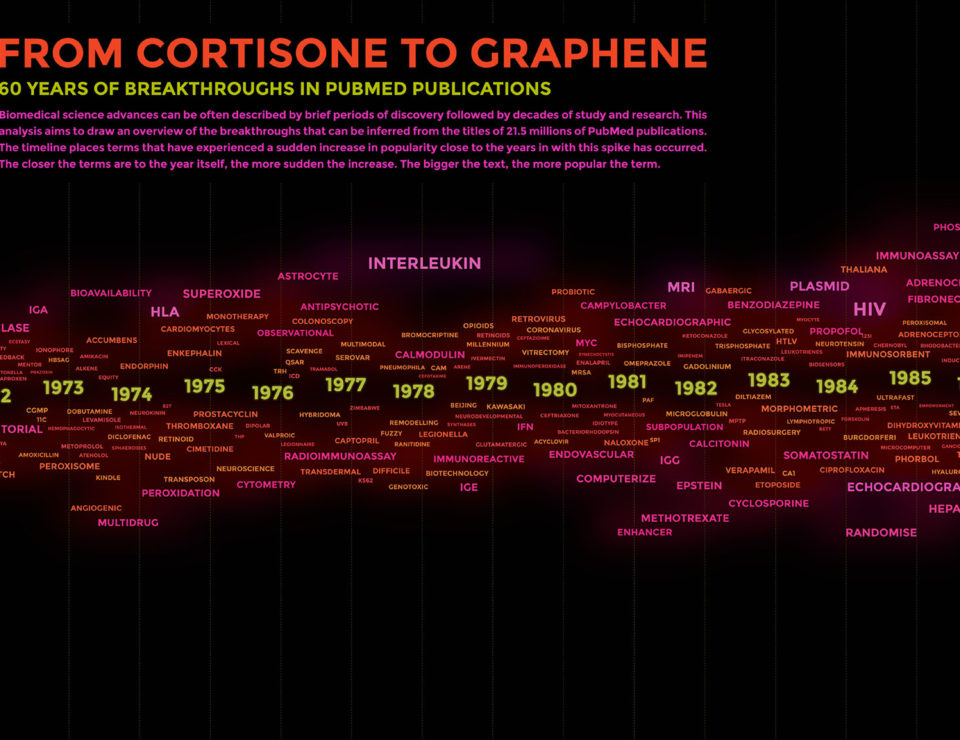
Biomedical science advances can often be described by brief periods of discovery followed by decades of study and research. This analysis aims to show an overview of the breakthroughs inferred from the titles of 21.5 millions of PubMed publications. For this visualization, we built a timeline of terms that have experienced a sudden increase in popularity in PubMed publication titles. more »
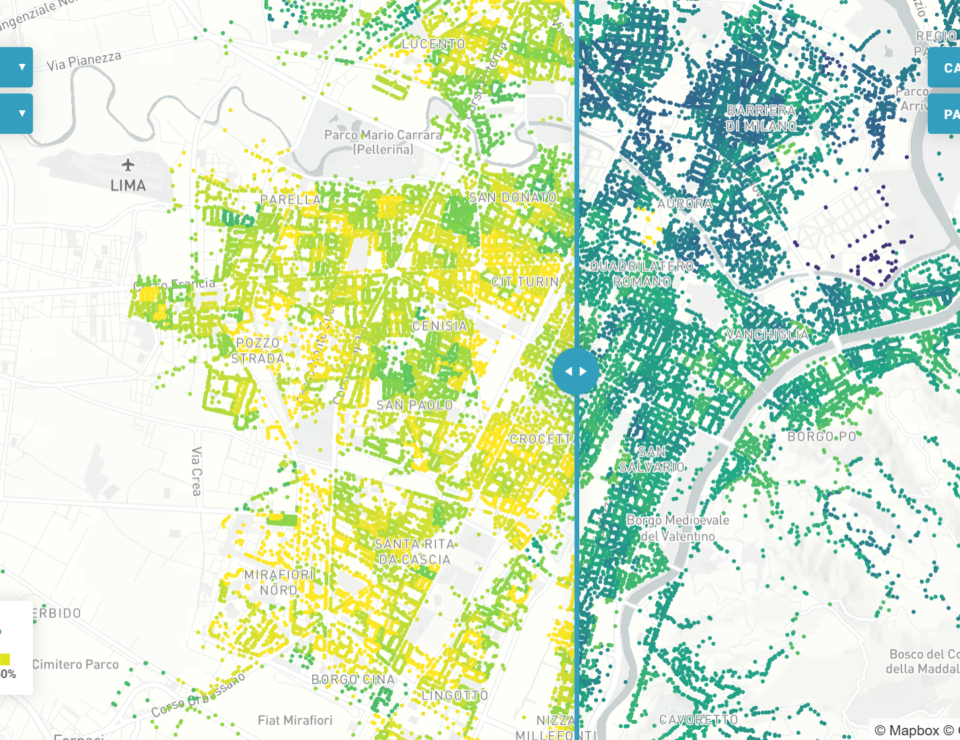
Il colore di Torino
Il Colore di Torino is an interface designed to explore the electoral landscape of the city of Torino after the European elections that took place on May 25, 2014.
Using the database provided by the Open Data Office of the city of Torino, the project combines the street numbers of the city and the electoral wards they are assigned to. Ballot results, as originally published by the Electoral Office of the city of Torino, are displayed on a map where each dot correponds to a street number. more »
Protest Maps
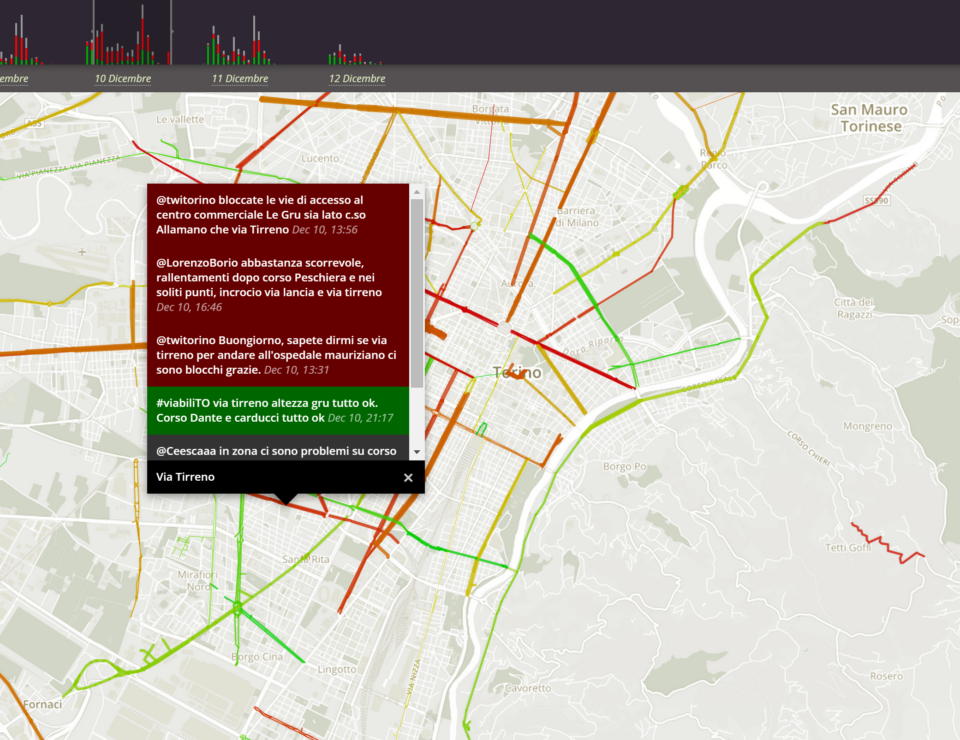
I Forconi a Torino is an interface designed to visualize tweets sent during the “Forconi” protest in Turin in order to inform fellow citizens about traffic conditions. Developed as an emergency project during the days of the protest, the visualization has been used by the population of Turin to have an overview of the traffic situation in the city. In the days between the 9th and 12th of December, the city of Turin experienced mobility problems because of the “Forconi” protest. In that context, Turin citizens, guided by the city’s / more »
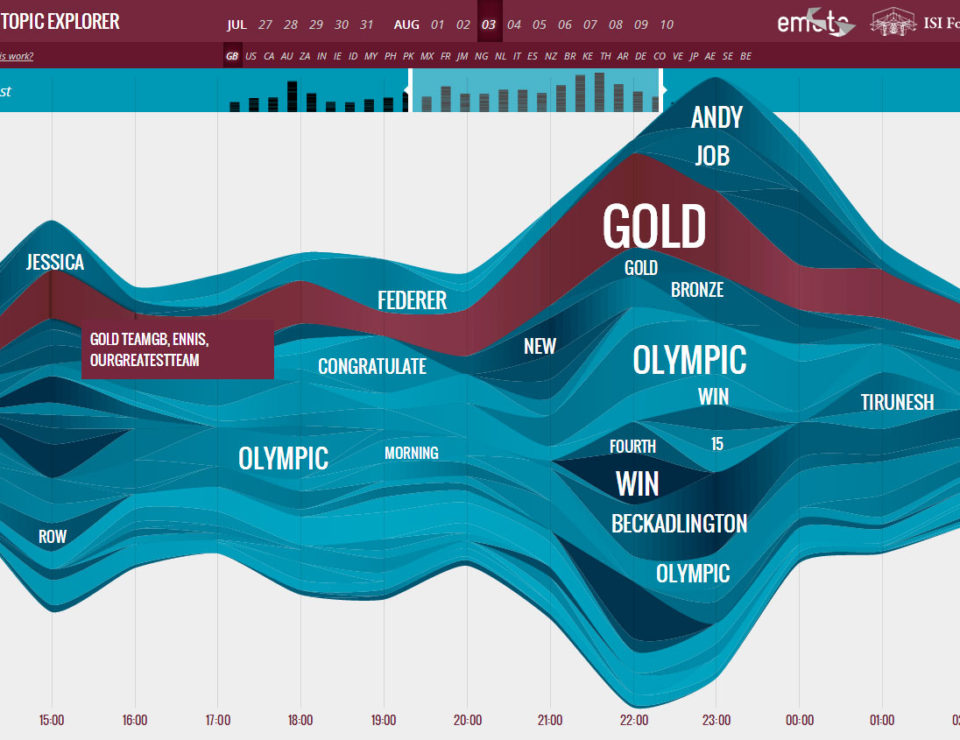
Twitter Topic Explorer
The Twitter Topic Explorer is an exploratory tool designed to expose and understand the temporal dynamics of Twitter conversations. Tweets related to a given event are recorded, and their content is processed to extract the main discussion topics and the activity of topics over time. By grouping thousand of tweets into thematic clusters, the Web interface provides a bird’s eye view on Twitter discussion and allows to navigate the time-varying topics and the attention they receive from different national communities of users. From a data analysis perspective, the aim is / more »
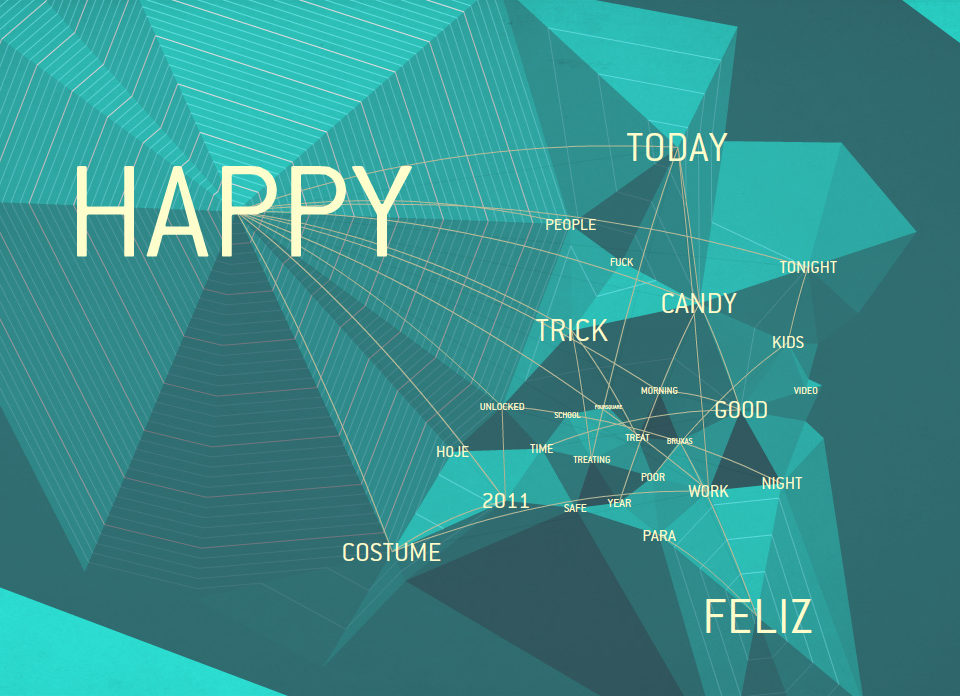
Twitter Orographies
Twitter Orographies is an experiment in the visualization of Twitter conversations. Built on top of previous experiments, this interfaces aims to represent the discussion space of around a given keyword. It represents the semantic space of topics that emerge, the relative relevance of each topic, and the relations between the different topics that arise from the discussion. Operationally, Twitter Orographies works by listening (in real time) to the stream of all the tweets that mention a given keyword (or hashtag). Each one of these tweets is then analyzed by removing / more »